Risk diagnosis results
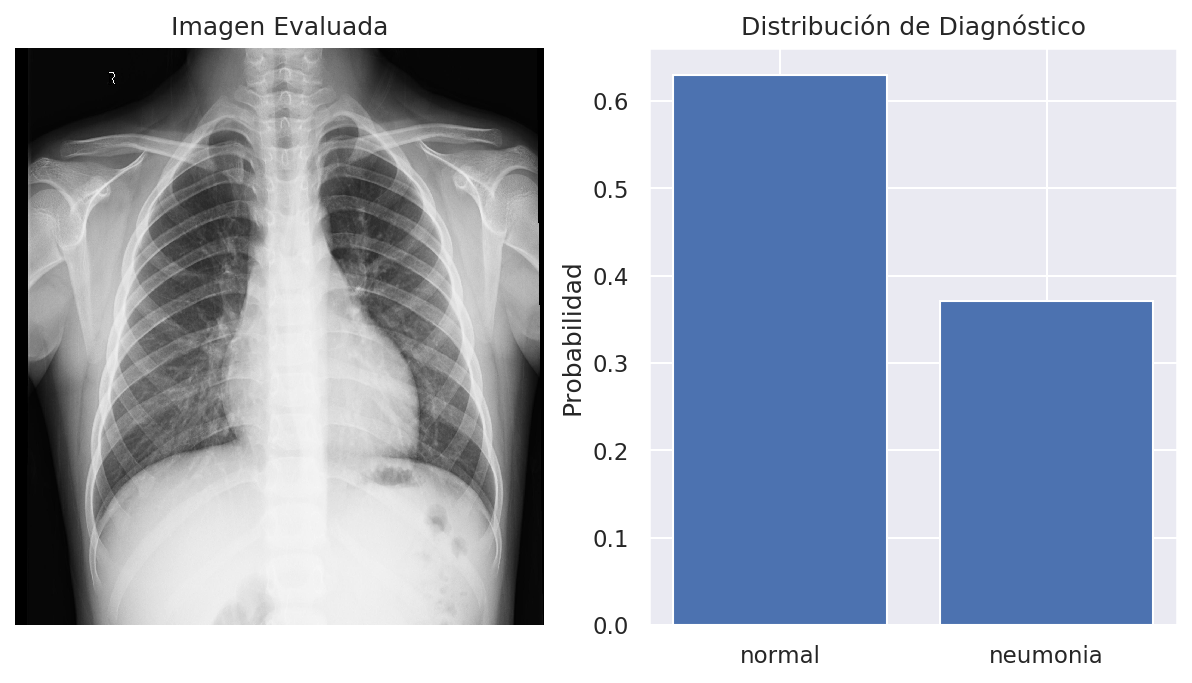
The diagnosis discards the presence of pneumonia in the patient. From the analysis, the patient present a normal state, with a 62.95% of confidence. Whereas the probability of having pneumonia is: 37.05%. The distribution for both states can be observed in the plot.
Diagnosis Summary: The patient do not show signs of having pneumonia.

Zonal Image Analysis
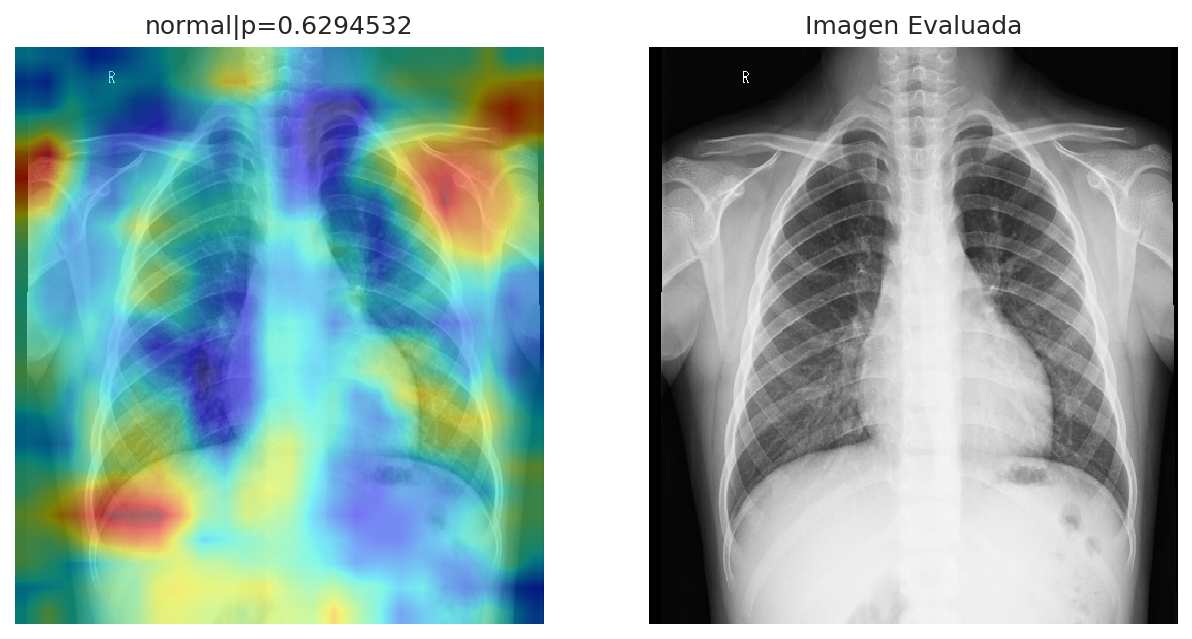
The zonal analysis shown, which areas from the image, where used to carry on the diagnosis. This represent the zones where the algorithm detect pneumonia or a normal state. The cold colors, represent the zones, which have a probability of having a normal state, whereas the warm colors represent the probability of pneumonia in such zones. This information is intended to bring support as evidence about the diagnosis. Since this application is under development, some zones mark areas out of the main image. This will be improved in the next iterations. To see the analysis in more detail, click on the image to zoom in.